Most members are complaining that they are not able to find good bargains because of the current stock market rally. We disagree there are couple of bargains available right now, check out the Valuation Screener to find them. There is one stock which is available at a huge discount right now but today we are going to tell why you should definitely avoid this stock. Karnataka Bank is currently under valued as per the valuation screener. Its intrinsic fair value is more than the current market price but that does not mean that you should buy it blindly.
Does it make sense to buy Karnataka Bank just because it is cheap right now? First of all never invest in any company just because the share price is cheap. We have to look at the financial charts of the company to see if the company is fundamentally good or not.
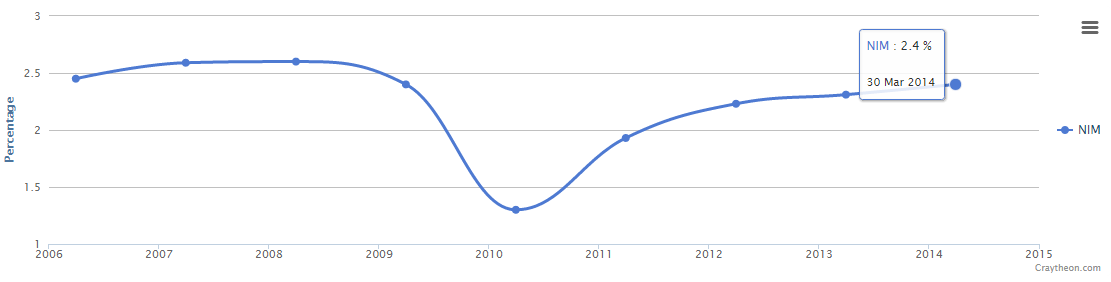
Lets look at the Net Interest Margin chart, NIM is the most important ratio when it comes to evaluating banks. It is the difference between the interest income generated and the interest expense paid, divided by total assets. An ideal bank should have NIM above 3%. If you look at Karnataka Bank’s NIM chart for the last 9 years you will see that its NIM never went above 3%. That is not a good sign.

Karnataka Bank NIM
Next we will look at the Non Performing Assets Ratio. NPA Ratio is used to measure asset quality of the bank’s loans. NPA are those assets for which interest is overdue for more than 3 months. If you stop paying your home loan EMI for more than 3 months then your loan account is considered to be a non performing asset.
Another important thing about banks is that you have to figure out if the management at the top is good or not. Big investors like Buffett and managers of mutual funds can directly talk to the managers of the bank. Investors like us cannot. So how do you figure out if the management of the bank is good and efficient. We look at the NPA Ratio chart, it acts like a proxy for the management. If the NPA Ratio is less than 1%, it means the bank’s loan book is healthy, above 1% is not healthy. If the NPA ratio is less than 1% for the last 10 years then that is a sign of a good bank with a terrific management.
Just look at Karnataka Bank’s NPA Ratio chart. It is atrocious.
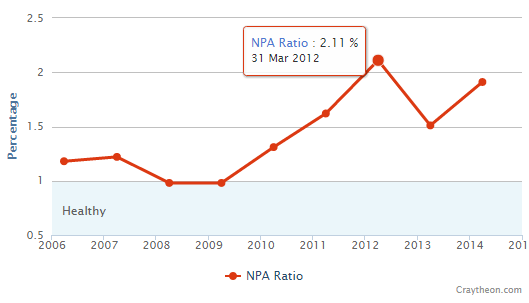
Karnataka NPA Ratio
On the other hand if you look at HDFC bank’s NPA chart, its NPA ratio has never gone above 1% in the last 10 years. That is a sign of well managed bank.
So Karnataka bank has bad NIM and a very bad NPA Ratio, its not being managed well, its not a good long term investment. You should avoid investing in Karnataka bank even if the share price is cheap.
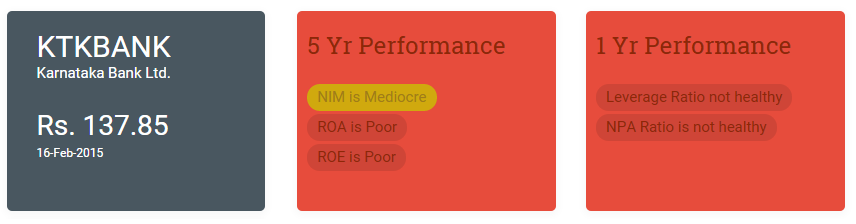
You don’t even have to look at the Summary Page to know that its a bad investment.

Karnataka Bank Summary Report